Explore challenges and solutions in AI chip development
Measurement of Total Jitter in High-Speed Serial I/O Links from the BER Bath-Tub Curves Using OptSim and ModeSYS
Jitter is a measure of the short-term time variations of the significant instances of a digital signal from its ideal positions in time. If these variations are very slow (within 10 Hz as per ITU), they are known as wander. Jitter affects extraction of clock and network timing. Although receivers in OptSim™ do not use clock and data recovery (CDR) circuits, it is possible to analyze jitter-induced penalties using OptSim. The three main sources of jitter are: (i) system-related sources such as crosstalk, dispersion, reflections/interference; (ii) data-dependent sources such as intersymbol interference, duty-cycle distortion; and (iii) random noise in the system [1].
Total jitter at a given BER is an important performance metric for high-speed serial I/O links. Estimating total jitter from the bath-tub curves is one of the methods for the measurement of total jitter [2-5]. This article describes how to obtain a bath-tub curve in OptSim and ModeSYS™ to measure jitter.
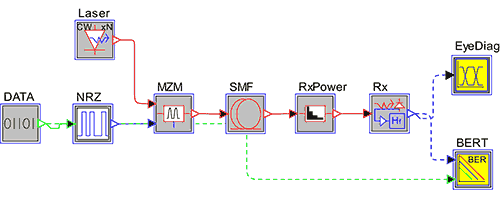
Consider a sample topology layout for a serial link under test as shown in Figure 1. The transmitter sends 10 Gbps of data over 10 km standard SMF. To simulate the effect of jitter in decision time due to imperfections in the detector circuitry, the BER tester’s timingJitter parameter is set to introduce the root-mean-square (RMS) deviation [6] in time.

Figure 1: Topology layout for this example
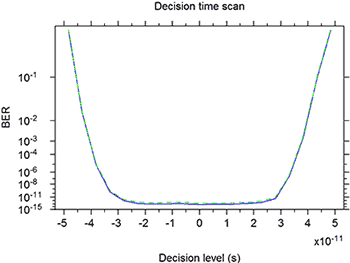
Setting the PlotDecisionTimeScan parameter in the Plotting tab of the BER tester model to YES provides a plot of scans of BER against decision time, commonly referred to as a “bathtub curve” [7]. Figure 2 shows the decision time scan plot at the BER Tester model after the simulation is over.

Figure 2: Plot of the decision time scan given by the BER tester model
The View Editor tab in the WinPLOT window allows chart post processing. In order for the decision time plot of Figure 2 to look like a conventional bathtub curve, the changes shown on the right in Figure 3 can be made (for more details on these commands, please refer to the WinPLOT manual).

Figure 3: WinPLOT editor windows of the original (left) and modified (right) plots
The WinPLOT commands on the right are:
/tkmx2 /tkmy2
/tt "BER Bathtub Curve"
/xl "Unit Interval (UI)"
/yl "BER"
/ly
/sx1.0E10
/tx0.5
/w0.0,1.0,-12.75,0
lstmp_BERT_decision_time_scan_BER.dat
- Line 1 specifies the number of tick mark locations on each axis (optional).
- Lines 2-4 denote plot title, X-axis label and Y-axis label, respectively.
- Line 5 resets the Y-axis scale from logarithmic to equi-spaced (linear) data plotting.
- Line 6 scales the X-axis (time axis) by data rate so that the duration is shown as a one-bit period (unit interval),
- Line 7 translates the X-axis by 0.5 so that the plot starts at 0 and ends at 1 full bit period instead of -0.5 UI to +0.5 UI (optional)
- Line 8 shows the displayed data range for X- and Y-axes (optional, can also be adjusted by mouse). Since a common practice is to specify total jitter at BER of 10-12, the Y-axis is data range is limited to around this value.
- Line 9 (the last line) is the name of the plot data file.
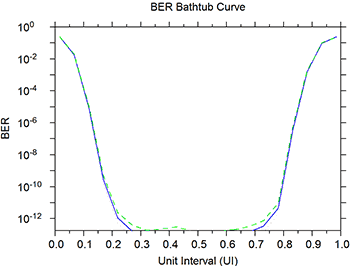
After the above changes, the BER bathtub curve looks like the plot shown in Figure 4.

Figure 4: Plot of the BER bathtub
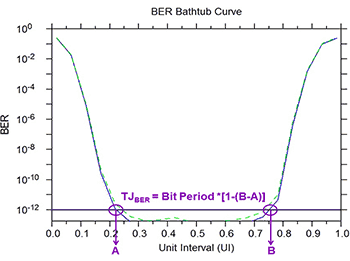
The peak-to-peak value for the total jitter at target BER (10-12 for the current case) is evaluated as shown in Figure 5.

Figure 5: Estimating total jitter at a BER of 10-12 from the bathtub
For the current setup, the bit period is 100 ps, A = 0.219, and B = 0.7533, thereby resulting in a total jitter of 46.57 ps at a BER of 10-12.
For more information on the types of jitter, various models of jitter, and additional jitter measurement techniques with associated factors to consider, please refer to the following references as a good starting point on the subject.
For more information, please contact photonics_support@synopsys.com.
References
- Hancock, J., “Jitter – Understanding it, Measuring it, Eliminating it Part 1: Jitter Fundamentals,” High Frequency Electronics, 2004, http://www.highfrequencyelectronics.com/Apr04/HFE0404_Hancock.pdf.
- Keysight, “Clock Jitter Analysis,” http://www.keysight.com/upload/cmc_upload/All/Clock_Jitter_Analysis_2008.pdf?&cc=US&lc=eng.
- Tektronix, “Understanding and Characterizing Timing Jitter Primer,” http://info.tek.com/rs/tektronix/images/55W_16146_5_MR_Letter.pdf.
- Kossel, M. A., and Schmatz, M. L., “Jitter Measurements of High-Speed Serial Links,” IEEE Design & Test of Computers, vol.21, no. 6, pp. 536-543, November/December 2004, doi:10.1109/MDT.2004.93.
- Ou, N., Farahmand, F., et al., “Jitter models for the design and test of Gbps-speed serial interconnects,” IEEE Design & Test of Computers, pp. 302-313, July-August 2004.
- Maxim Integrated, “Converting between RMS and Peak-to-Peak Jitter at a specified BER,” http://pdfserv.maximintegrated.com/en/an/AN462.pdf.
- Oh, K. S., Lambrecht, et al., “Accurate system voltage and timing margin simulation in high-speed I/O system designs,” IEEE Transactions on Advanced Packaging , vol 31, no. 4, pp. 722-730, Nov. 2008 (http://www.rle.mit.edu/isg/documents/Oh_TAP08.pdf).


